
- If you are wondering whether Cboe Global Markets is offering fair value at its current price, this article will walk through how the market might be pricing the stock today.
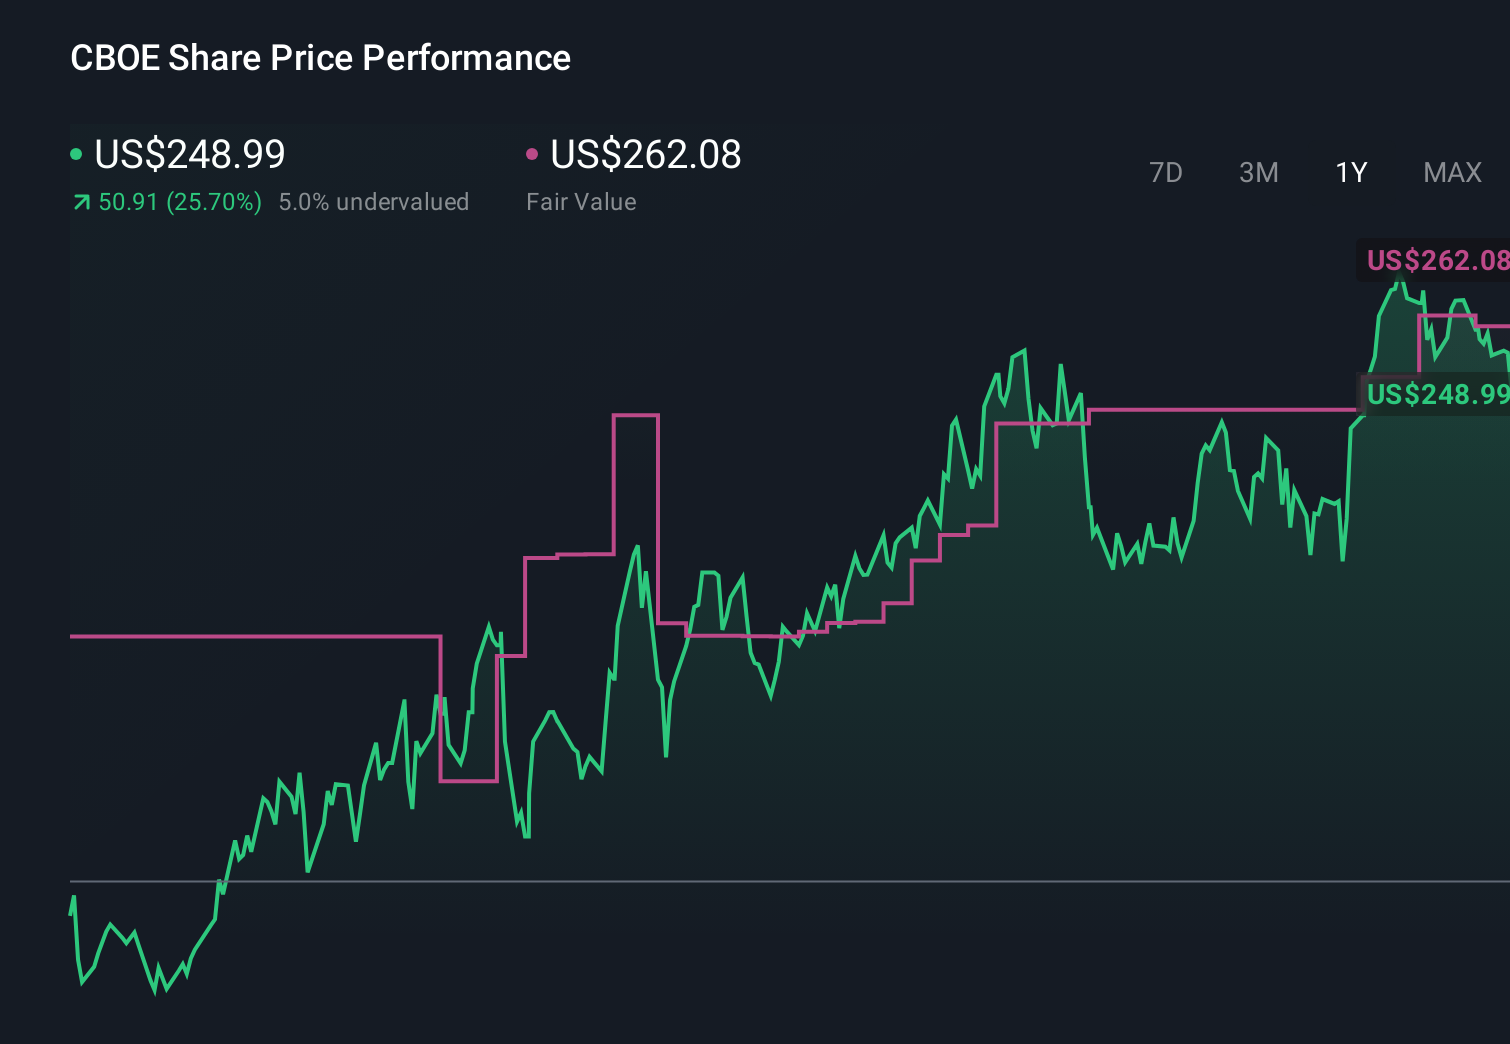
- Cboe shares last closed at US$273.55, with returns of 4.8% over 7 days, 8.4% over 30 days, 10.3% year to date, 42.1% over 1 year and 132.3% over 3 years. This gives important context before comparing the price to underlying value.
- Recent coverage has focused on Cboe’s role as a major exchange group and provider of trading, clearing and market data services, as investors assess how this position fits into long term demand for listed products and market infrastructure. This background helps frame why the share price has moved the way it has over different time frames, and why valuation has become a key question for many investors.
- On Simply Wall St’s valuation checks, Cboe Global Markets currently has a value score of 1 out of 6. Next we will look at how different valuation methods line up with that score and then finish with a broader way to think about what the stock might be worth.
Cboe Global Markets scores just 1/6 on our valuation checks. See what other red flags we found in the full valuation breakdown.
Advertisement
Approach 1: Cboe Global Markets Excess Returns Analysis
The Excess Returns model looks at how much profit a company is expected to generate above the return that shareholders require, then converts those “excess” profits into an estimated per share value today.
For Cboe Global Markets, analysts expect a stable earnings figure of about $12.02 per share, based on weighted future Return on Equity estimates from 4 analysts. That is being generated off a current book value of $46.68 per share, with an average Return on Equity of 21.12%. The model applies a cost of equity of $4.67 per share. After covering that cost, the remaining excess return is estimated at $7.35 per share.
Looking ahead, the model also uses a stable book value estimate of $56.88 per share, based on weighted future Book Value estimates from 2 analysts, to extend those excess returns into the future and discount them back to today.
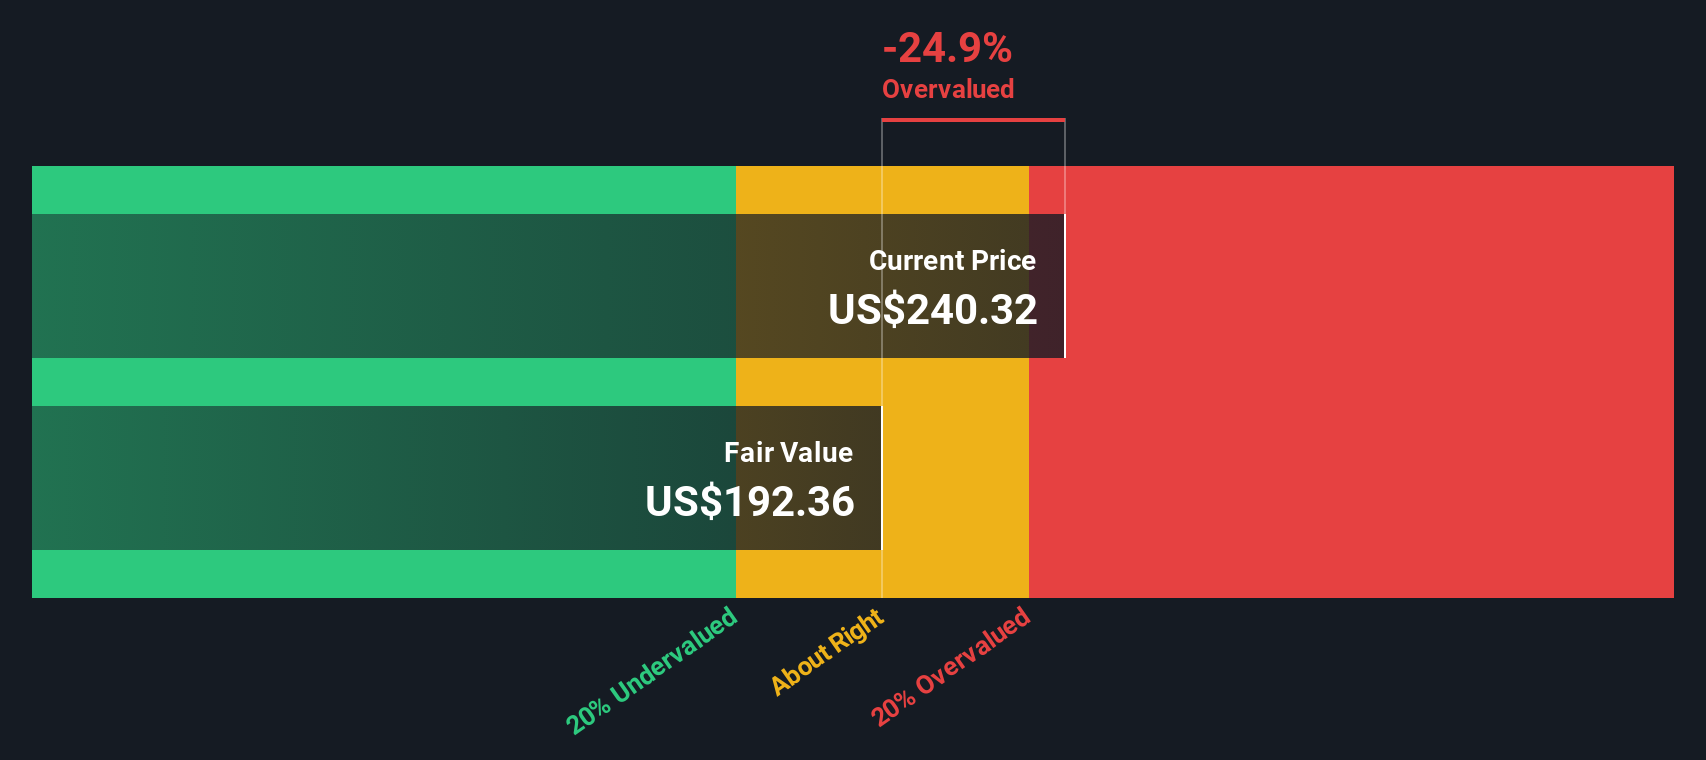
This process produces an intrinsic value estimate of about $205.33 per share. Compared with the recent share price of US$273.55, the Excess Returns model implies the stock is about 33.2% overvalued.
Result: OVERVALUED
Our Excess Returns analysis suggests Cboe Global Markets may be overvalued by 33.2%. Discover 863 undervalued stocks or create your own screener to find better value opportunities.
Approach 2: Cboe Global Markets Price vs Earnings
For profitable companies like Cboe Global Markets, the P/E ratio is a useful way to link what you pay per share to the earnings the business is generating today. It lets you quickly see how many dollars investors are currently willing to pay for each dollar of earnings.
What counts as a “normal” P/E depends a lot on expectations and risk. Higher expected earnings growth or more resilient profitability can justify a higher multiple, while greater uncertainty or weaker profitability usually points to a lower one.
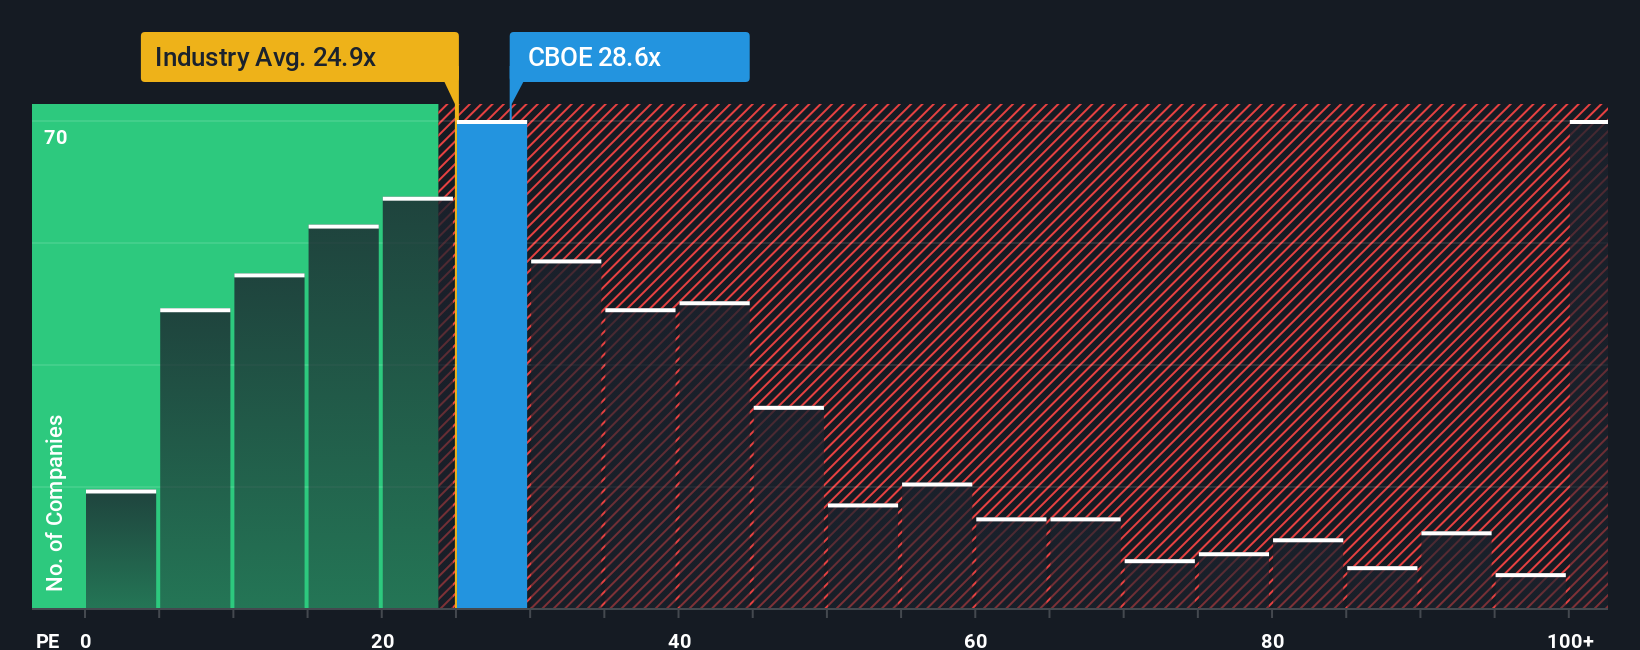
Cboe currently trades on a P/E of 29.26x. That sits above the Capital Markets industry average P/E of 25.78x and below the peer average of 31.59x. Simply Wall St’s Fair Ratio for Cboe is 15.19x, which is its proprietary estimate of what a reasonable P/E might be once you factor in things like the company’s earnings profile, profit margin, industry, market cap and key risks.
Compared with a simple peer or industry comparison, the Fair Ratio aims to adjust for those business specific factors rather than assuming every company deserves roughly the same multiple. With Cboe’s actual P/E well above its Fair Ratio, this framework suggests the shares are trading at a richer level than those fundamentals alone might support.
Result: OVERVALUED
P/E ratios tell one story, but what if the real opportunity lies elsewhere? Discover 1445 companies where insiders are betting big on explosive growth.
Upgrade Your Decision Making: Choose your Cboe Global Markets Narrative
Earlier we mentioned that there is an even better way to understand valuation. On Simply Wall St you can use Narratives, where you set out your story for Cboe Global Markets, plug in your own revenue, earnings and margin expectations, link them to a forecast and fair value, then compare that fair value with the current price to see if the stock fits your buy or sell rules. The Community page shows a range of Narratives from millions of users and updates automatically when fresh news or earnings arrive. For example, one Cboe Narrative might lean toward the higher US$265 analyst target with confidence in data revenues and new contracts, while another might sit closer to the lower US$216 view and focus on risks around fee capture, concentration in key index partnerships and emerging fintech threats.
Do you think there’s more to the story for Cboe Global Markets? Head over to our Community to see what others are saying!
This article by Simply Wall St is general in nature. We provide commentary based on historical data
and analyst forecasts only using an unbiased methodology and our articles are not intended to be financial advice. It does not constitute a recommendation to buy or sell any stock, and does not take account of your objectives, or your
financial situation. We aim to bring you long-term focused analysis driven by fundamental data.
Note that our analysis may not factor in the latest price-sensitive company announcements or qualitative material.
Simply Wall St has no position in any stocks mentioned.
New: AI Stock Screener & Alerts
Our new AI Stock Screener scans the market every day to uncover opportunities.
• Dividend Powerhouses (3%+ Yield)
• Undervalued Small Caps with Insider Buying
• High growth Tech and AI Companies
Or build your own from over 50 metrics.
Have feedback on this article? Concerned about the content? Get in touch with us directly. Alternatively, email editorial-team@simplywallst.com