
As global markets navigate a period of economic uncertainty, recent data on the U.S. labor market and interest rate expectations have influenced investor sentiment, particularly impacting smaller-cap stocks that tend to be more sensitive to such shifts. While the broader market reflects mixed signals, with some indices gaining modestly despite concerns over growth, this environment can present opportunities for discerning investors seeking undiscovered gems in global equities.
In this context, identifying promising stocks often involves looking beyond headline performance to consider factors like resilience in challenging conditions and potential for long-term growth amid fluctuating economic indicators.
Advertisement
Top 10 Undiscovered Gems With Strong Fundamentals Globally
| Name | Debt To Equity | Revenue Growth | Earnings Growth | Health Rating |
|---|---|---|---|---|
| Lion Rock Group | 5.00% | 14.21% | 13.26% | ★★★★★★ |
| VICOM | NA | 6.95% | 4.06% | ★★★★★★ |
| Daphne International Holdings | NA | -5.92% | 82.03% | ★★★★★★ |
| HG Metal Manufacturing | 3.75% | 8.47% | 6.94% | ★★★★★★ |
| Yibin City Commercial Bank | 82.57% | -1.19% | 15.94% | ★★★★★★ |
| Taiyo KagakuLtd | 0.67% | 5.77% | 2.06% | ★★★★★☆ |
| Changjiu Holdings | 50.46% | 54.90% | 14.57% | ★★★★★☆ |
| Etihad Atheeb Telecommunication | 0.97% | 37.69% | 60.25% | ★★★★★☆ |
| Practic | NA | 4.86% | 6.64% | ★★★★☆☆ |
| TSTE | 38.15% | 4.63% | -6.91% | ★★★★☆☆ |
Here’s a peek at a few of the choices from the screener.
Simply Wall St Value Rating: ★★★★★★
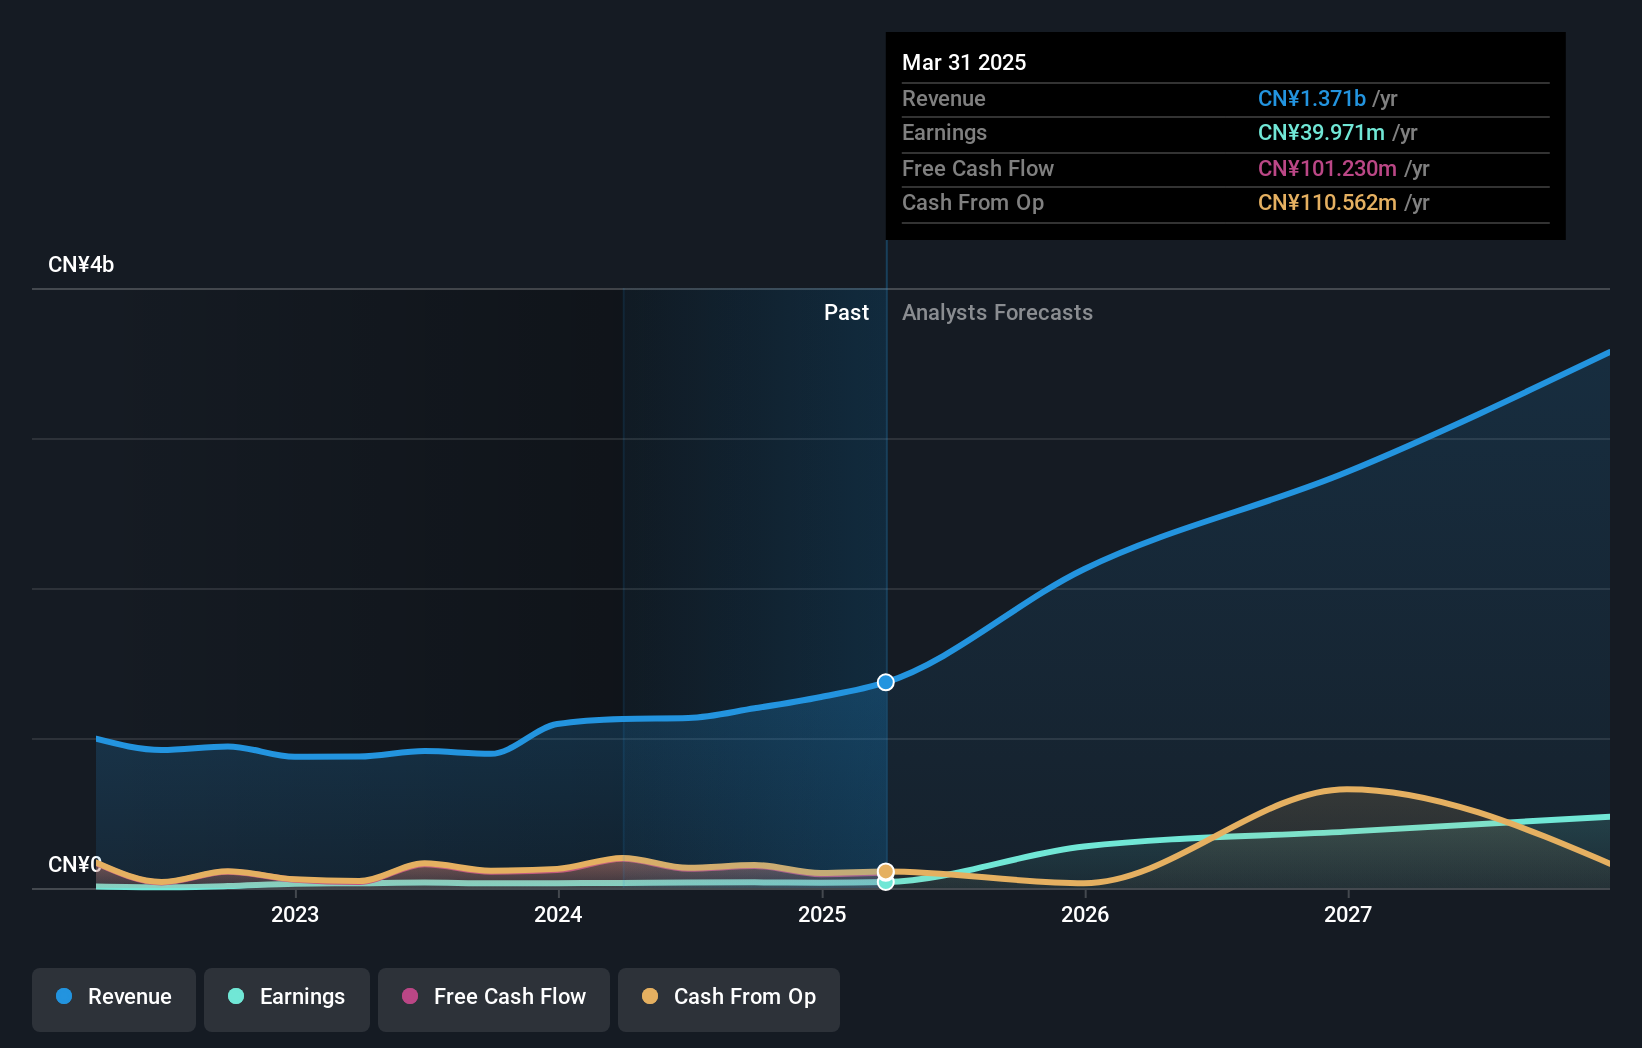
Overview: Shanghai Cooltech Power Co., Ltd. manufactures and sells power generation equipment in China, with a market cap of CN¥11.70 billion.
Operations: The company generates revenue primarily from the sale of power generation equipment. It has reported fluctuations in its financial performance, with a notable net profit margin trend that may interest investors.
Shanghai Cooltech Power, a smaller player in the power solutions industry, has demonstrated robust financial performance recently. Over the past year, earnings grew by 10.9%, outpacing the electrical industry’s -0.8% growth rate. The company’s net income for the first half of 2025 reached CNY 23.99 million, up from CNY 17.71 million a year earlier, with sales jumping to CNY 686.6 million from CNY 440.62 million previously reported for the same period last year. Despite a volatile share price over recent months, Cooltech’s debt-to-equity ratio improved from 17% to 15% over five years, reflecting prudent financial management and potential for future growth amidst industry challenges.
Simply Wall St Value Rating: ★★★★★★
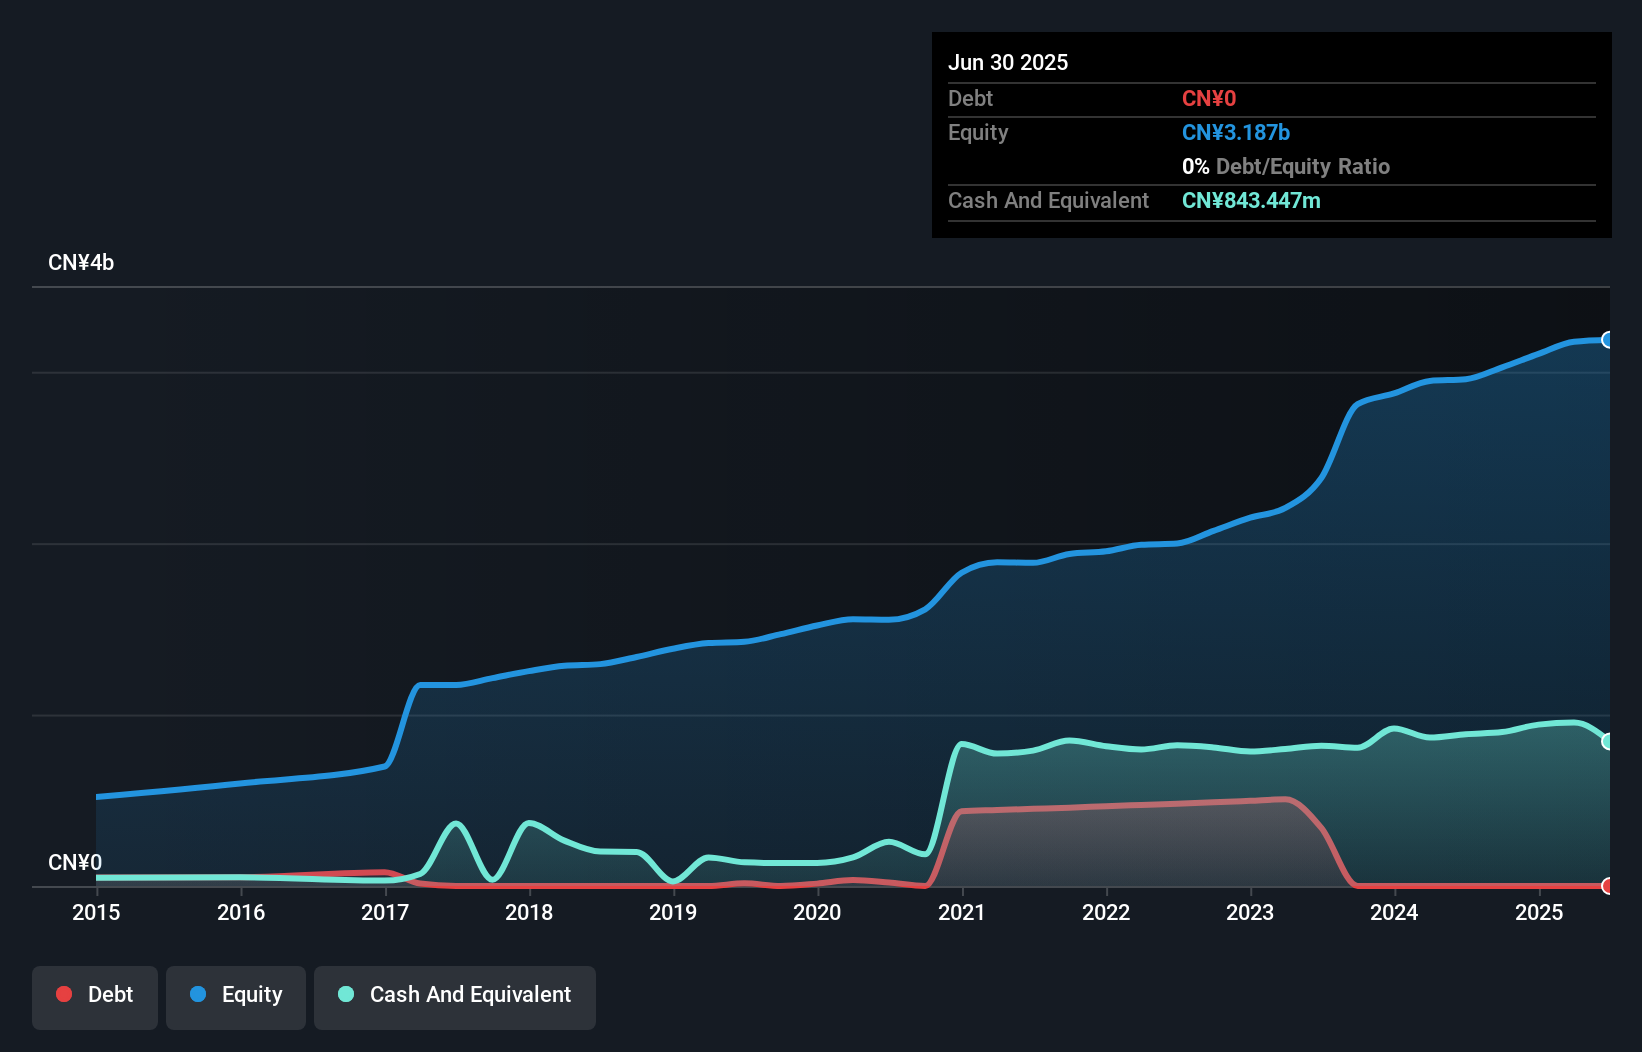
Overview: Wuxi Best Precision Machinery Co., Ltd. specializes in the research, development, production, and sale of precision parts, intelligent equipment, and tooling products both in China and internationally with a market capitalization of CN¥13.98 billion.
Operations: Wuxi Best Precision Machinery generates revenue primarily from the sale of precision parts, intelligent equipment, and tooling products. The company has a market capitalization of CN¥13.98 billion.
Wuxi Best Precision Machinery, a nimble player in the auto components sector, has shown resilience with earnings growth of 5.7% over the past year, outpacing the industry average of 2.3%. The company is debt-free now, a significant shift from five years ago when its debt to equity ratio was 1.3%. For the first half of 2025, they reported sales of CNY 696.04 million and net income rose to CNY 148.47 million from CNY 143.73 million last year. Their recent dividend proposal suggests confidence in continued profitability amidst forecasted earnings growth at an impressive rate of 15.41% annually.
Simply Wall St Value Rating: ★★★★☆☆
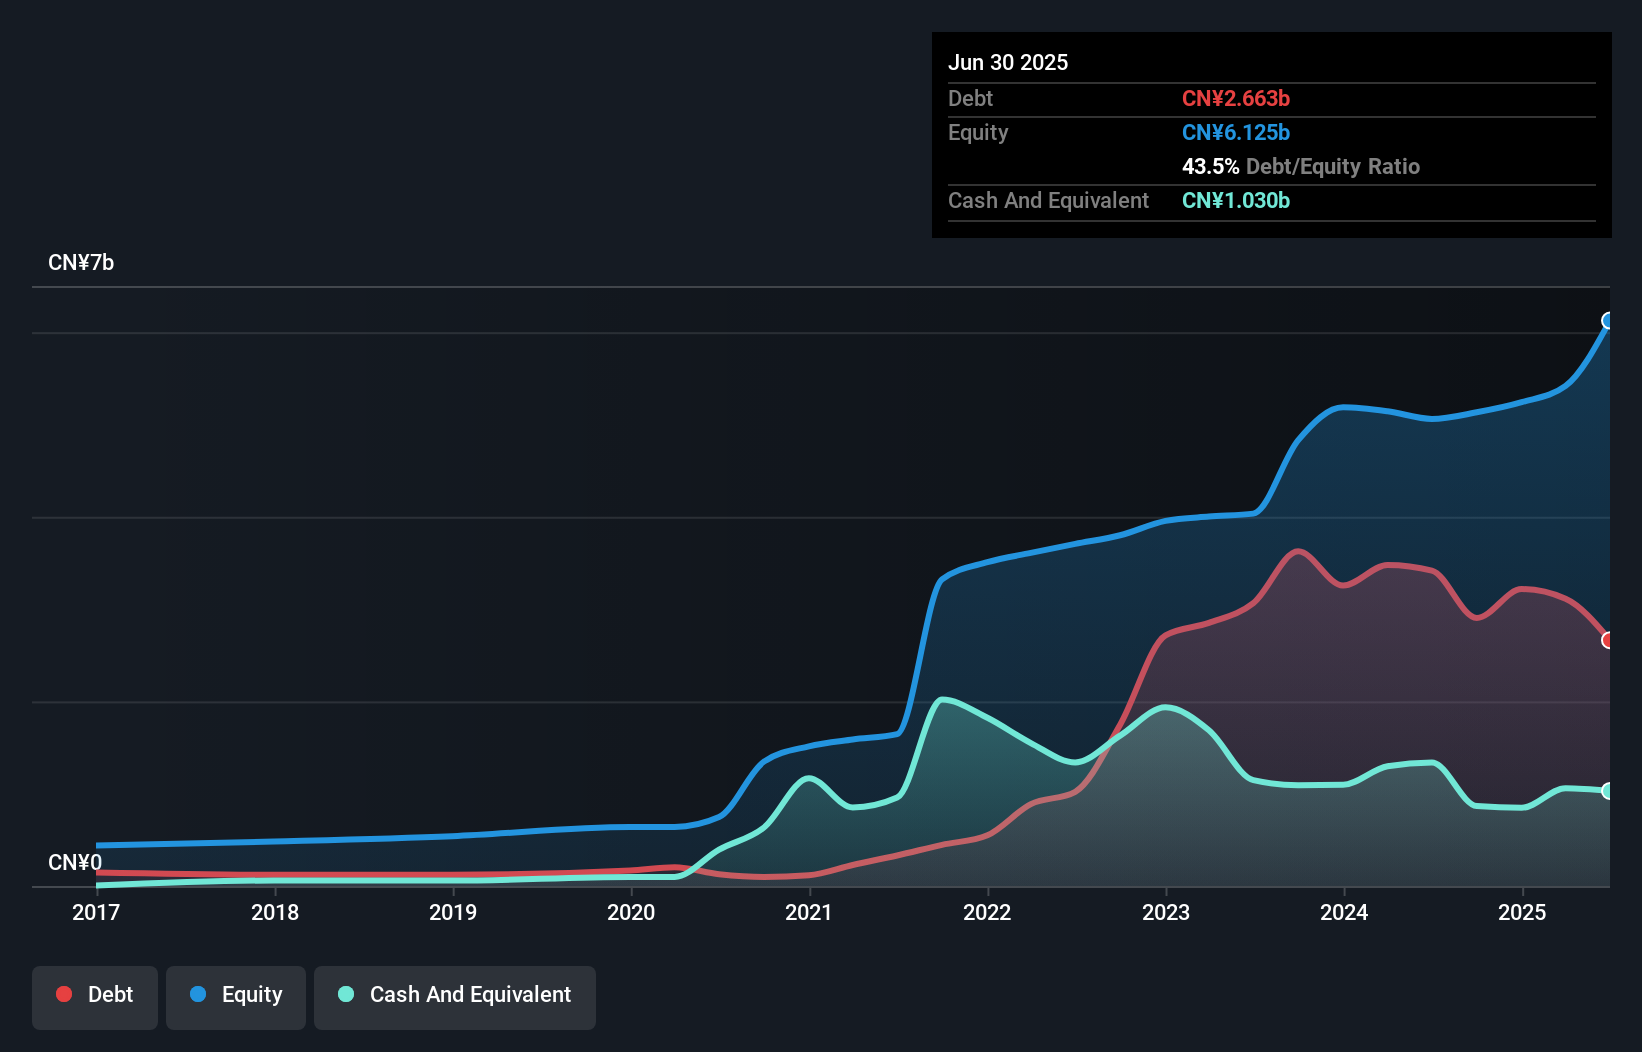
Overview: Luoyang Xinqianglian Slewing Bearing Co., Ltd. specializes in the production and sale of slewing bearings, with a market cap of CN¥13.57 billion.
Operations: Luoyang Xinqianglian generates revenue primarily through the sale of slewing bearings. The company’s net profit margin is 16.5%, reflecting its efficiency in converting sales into actual profit.
Luoyang Xinqianglian Slewing Bearing has shown impressive growth, with earnings soaring by 226% in the last year, outpacing the machinery industry’s 4% rise. The company’s net debt to equity ratio stands at a satisfactory 26.7%, reflecting prudent financial management despite an increase from 17.2% over five years. In recent results for the half-year ending June 2025, sales reached CNY 2.07 billion compared to CNY 994 million a year prior, while net income hit CNY 399 million versus a previous loss of CNY 100 million. Trading at a price-to-earnings ratio of 25x, it offers good value relative to peers and industry standards.
Seize The Opportunity
- Dive into all 2955 of the Global Undiscovered Gems With Strong Fundamentals we have identified here.
- Already own these companies? Bring clarity to your investment decisions by linking up your portfolio with Simply Wall St, where you can monitor all the vital signs of your stocks effortlessly.
- Take control of your financial future using Simply Wall St, offering free, in-depth knowledge of international markets to every investor.
Ready To Venture Into Other Investment Styles?
This article by Simply Wall St is general in nature. We provide commentary based on historical data
and analyst forecasts only using an unbiased methodology and our articles are not intended to be financial advice. It does not constitute a recommendation to buy or sell any stock, and does not take account of your objectives, or your
financial situation. We aim to bring you long-term focused analysis driven by fundamental data.
Note that our analysis may not factor in the latest price-sensitive company announcements or qualitative material.
Simply Wall St has no position in any stocks mentioned.
New: Manage All Your Stock Portfolios in One Place
We’ve created the ultimate portfolio companion for stock investors, and it’s free.
• Connect an unlimited number of Portfolios and see your total in one currency
• Be alerted to new Warning Signs or Risks via email or mobile
• Track the Fair Value of your stocks
Have feedback on this article? Concerned about the content? Get in touch with us directly. Alternatively, email editorial-team@simplywallst.com