
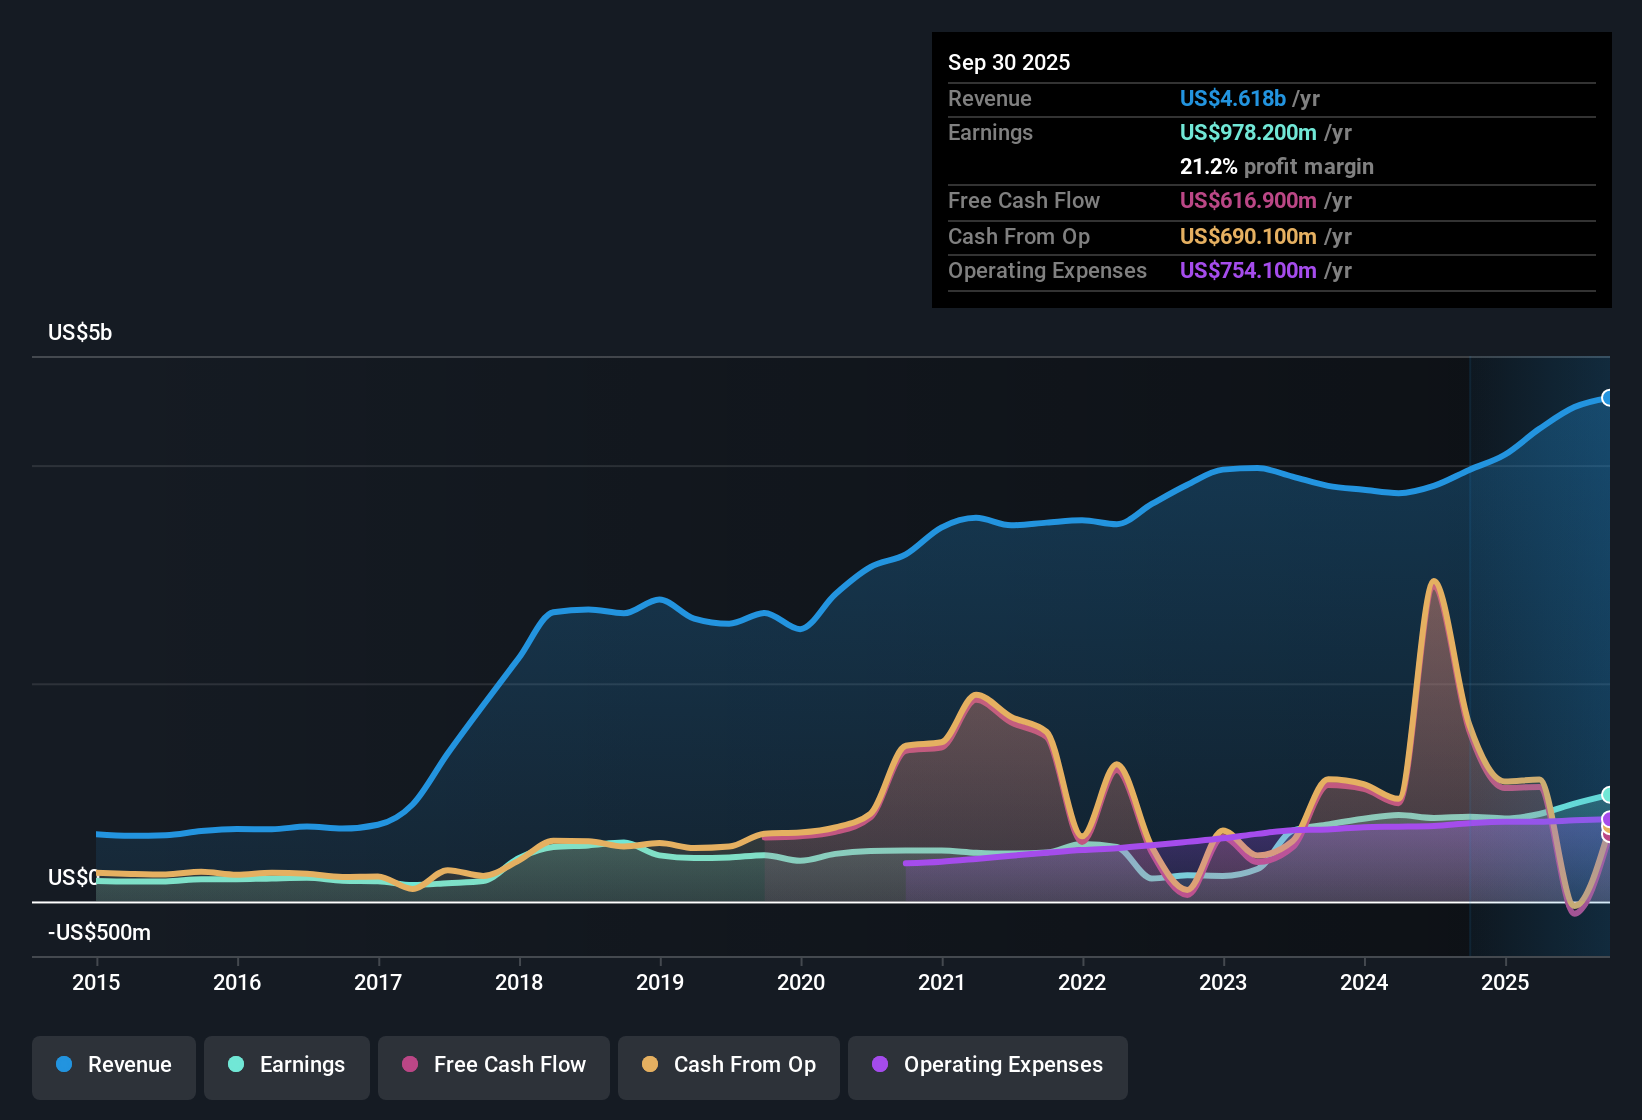
Cboe Global Markets (CBOE) closed FY 2025 with Q4 revenue of US$1.2b and basic EPS of US$2.99, setting the tone for a year where trailing twelve month revenue reached US$4.7b and EPS came in at US$10.46. The company has seen revenue move from US$4.1b and EPS of US$7.24 on a trailing basis at the end of 2024 to US$4.7b and EPS of US$10.46 by Q4 2025, framing a set of results where stronger earnings sit alongside improved profitability ratios and provide investors with a clearer view of margins.
See our full analysis for Cboe Global Markets.
With the headline numbers on the table, the next step is to weigh these results against the main bull and bear narratives that investors follow to see which views line up with the data and which ones start to look stretched.
Curious how numbers become stories that shape markets? Explore Community Narratives
Advertisement
Margins Strengthen With 23.2% Net Profit
- Cboe’s trailing net profit margin sits at 23.2%, up from 18.6% a year earlier, alongside trailing twelve month net income of US$1.1b on US$4.7b of revenue.
- What is interesting for the bullish view is that a 43.9% earnings increase over the last year comes alongside this higher margin, which:
- Pairs US$1.1b of trailing net income with trailing EPS of US$10.46 and gives bulls concrete evidence of profit per share, not just top line expansion.
- Shows a margin that is above last year’s 18.6% and supports the idea that the business is keeping more of each revenue dollar even as forecasts call for slower earnings growth of about 5.6% a year.
Earnings Growth Outruns Softer Revenue Outlook
- Trailing twelve month earnings grew 43.9% while earnings have averaged 21.6% growth per year over five years, yet forecasts point to earnings growth of about 5.6% a year and an annual 15.6% revenue decline over the next three years.
- Bears focus on the tension between strong recent earnings and the forecast revenue decline, which:
- Combines a trailing US$4.7b revenue base with the expectation of a 15.6% annual revenue fall and raises questions about how long the 23.2% net margin and US$10.46 EPS can hold up if the top line shrinks.
- Contrasts a 43.9% trailing earnings jump with forward earnings growth that is below the 15.6% US market forecast and provides a gap skeptics point to when they worry about the durability of recent growth.
P/E Premium Versus DCF Fair Value
- The current P/E of 26.1x sits above the US Capital Markets industry at 22.9x and roughly in line with peers at 25.9x, while the share price of US$273.36 trades above a DCF fair value of about US$217.26.
- For investors weighing a more cautious view, valuation metrics create clear friction with the strong earnings story, because:
- The US$273.36 share price is higher than the DCF fair value of about US$217.26 even after a year where net income reached US$1.1b and EPS hit US$10.46, which critics argue limits room for error if the forecast 15.6% annual revenue decline plays out.
- The 26.1x P/E is above the 22.9x industry average while earnings growth is projected at around 5.6% a year, below the wider US market’s 15.6% forecast, and this gives bears a clear data point when they question how much future growth is already reflected in the price.
Stay updated on how fresh earnings data and valuation signals reshape the story for Cboe, and see the full market narrative investors are building around it:Curious how numbers become stories that shape markets? Explore Community Narratives
Next Steps
Don’t just look at this quarter; the real story is in the long-term trend. We’ve done an in-depth analysis on Cboe Global Markets’s growth and its valuation to see if today’s price is a bargain. Add the company to your watchlist or portfolio now so you don’t miss the next big move.
See What Else Is Out There
Cboe’s premium 26.1x P/E and share price above its DCF fair value sit alongside forecasts for slower 5.6% earnings growth and a 15.6% annual revenue decline.
If you are uneasy about paying a premium for slower forecast growth, take a moment to check out 53 high quality undervalued stocks that may offer stronger value for your watchlist.
This article by Simply Wall St is general in nature. We provide commentary based on historical data
and analyst forecasts only using an unbiased methodology and our articles are not intended to be financial advice. It does not constitute a recommendation to buy or sell any stock, and does not take account of your objectives, or your
financial situation. We aim to bring you long-term focused analysis driven by fundamental data.
Note that our analysis may not factor in the latest price-sensitive company announcements or qualitative material.
Simply Wall St has no position in any stocks mentioned.
New: AI Stock Screener & Alerts
Our new AI Stock Screener scans the market every day to uncover opportunities.
• Dividend Powerhouses (3%+ Yield)
• Undervalued Small Caps with Insider Buying
• High growth Tech and AI Companies
Or build your own from over 50 metrics.
Have feedback on this article? Concerned about the content? Get in touch with us directly. Alternatively, email editorial-team@simplywallst.com