
As global markets navigate a landscape marked by potential rate cuts and fluctuating economic indicators, small-cap indices like the S&P Mid-Cap 400 and the Russell 2000 have shown robust performance, reflecting renewed investor interest in these segments. In this dynamic environment, identifying stocks with strong fundamentals and growth potential can be key to uncovering undiscovered gems that may thrive despite broader market uncertainties.
Advertisement
Top 10 Undiscovered Gems With Strong Fundamentals Globally
| Name | Debt To Equity | Revenue Growth | Earnings Growth | Health Rating |
|---|---|---|---|---|
| Ruentex Interior Design | NA | 32.58% | 38.70% | ★★★★★★ |
| Sinopower Semiconductor | NA | 0.64% | -7.63% | ★★★★★★ |
| Baazeem Trading | 8.48% | -1.74% | -2.37% | ★★★★★★ |
| Thai Steel Cable | NA | 4.17% | 18.81% | ★★★★★★ |
| China Leon Inspection Holding | 10.37% | 18.71% | 17.95% | ★★★★★★ |
| Tai Sin Electric | 28.69% | 9.56% | 4.66% | ★★★★★☆ |
| Gallant Precision Machining | 67.06% | -0.08% | 7.83% | ★★★★★☆ |
| Shanghai Pioneer Holding | 5.59% | 4.81% | 18.60% | ★★★★★☆ |
| Uniplus Electronics | 45.33% | 46.79% | 73.91% | ★★★★★☆ |
| Banyan Tree Holdings | 42.74% | 15.33% | 72.59% | ★★★★☆☆ |
We’ll examine a selection from our screener results.
Simply Wall St Value Rating: ★★★★☆☆
Overview: Shanghai Haoyuan Chemexpress Co., Ltd. focuses on the research, development, and manufacturing of pharmaceutical intermediates and small molecule drugs, with a market cap of CN¥12.77 billion.
Operations: Haoyuan Chemexpress generates its revenue primarily from the pharmaceutical sector, focusing on intermediates and small molecule drugs. The company’s financial performance is characterized by a gross profit margin of 45%, reflecting its efficiency in managing production costs relative to sales.
Shanghai Haoyuan Chemexpress, a smaller player in the Life Sciences sector, has demonstrated impressive earnings growth of 152% over the past year, outpacing the industry average. The company’s net debt to equity ratio stands at a satisfactory 14%, indicating prudent financial management. Despite this financial strength, its share price has been highly volatile recently. Notably, their interest payments are well covered by EBIT at 9 times coverage. In recent developments, they completed a share buyback program repurchasing 47,725 shares as of July 2025. Earnings for the first half of 2025 are expected shortly on August 29th.

Simply Wall St Value Rating: ★★★★☆☆
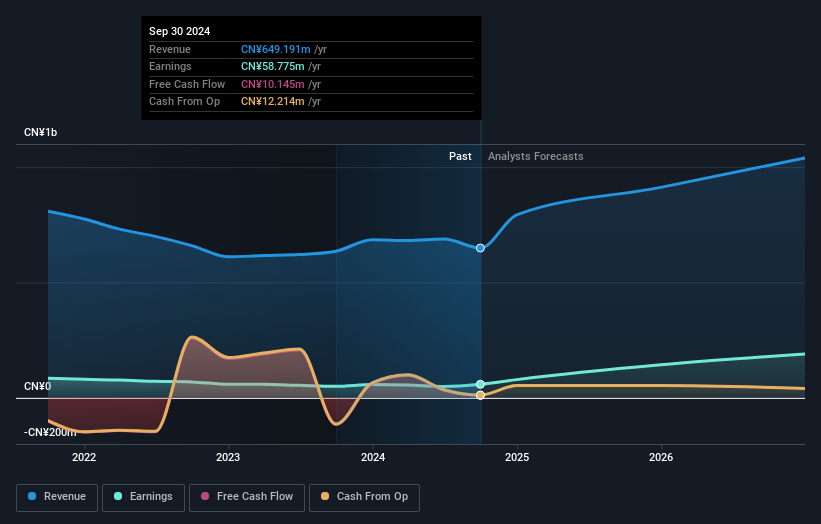
Overview: Hui Lyu Ecological Technology Groups Co., Ltd. operates in the ecological technology sector and has a market capitalization of CN¥10.98 billion.
Operations: Hui Lyu Ecological Technology Groups Co., Ltd. generates revenue primarily through its operations in the ecological technology sector, with a market capitalization of CN¥10.98 billion.
Hui Lyu Ecological Technology Groups Ltd. has shown remarkable earnings growth of 48.7% over the past year, surpassing the industry average of 0.6%. Despite a satisfactory net debt to equity ratio of 20.1%, their debt to equity ratio has increased from 32% to 43.3% in five years, indicating potential leverage concerns. The company is profitable and interest coverage isn’t an issue, but it struggles with free cash flow positivity. Recent developments include a proposal for changes in business scope and articles of association at an upcoming shareholder meeting, alongside plans for private placements aimed at raising additional funds with a six-month lock-up period on issued securities.
Simply Wall St Value Rating: ★★★★★☆
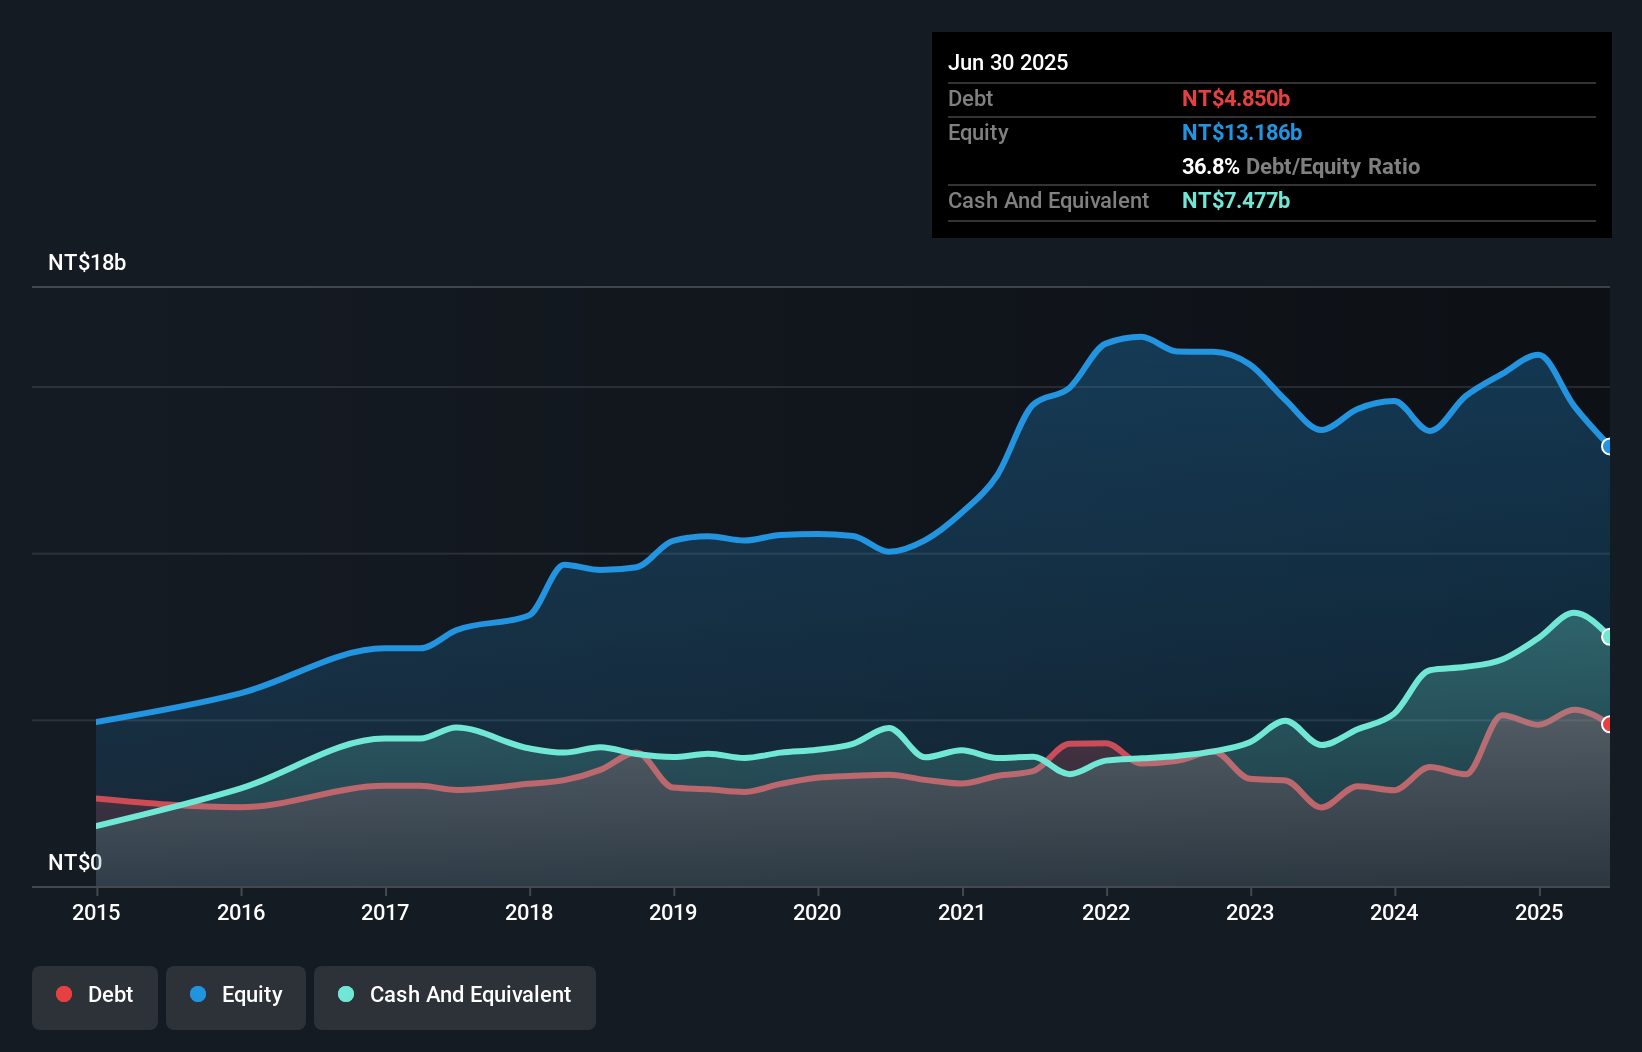
Overview: Nan Pao Resins Chemical Co., Ltd. is involved in the production and distribution of synthetic resins, adhesives, coatings, dyes, and pigments across various regions including Asia, Oceania, Europe, America, and Africa with a market cap of NT$45.33 billion.
Operations: The company’s revenue primarily comes from Taiwan, Mainland China, and Vietnam, contributing NT$8.61 billion, NT$7.90 billion, and NT$7.41 billion respectively. The net profit margin reflects the company’s profitability after accounting for all expenses and taxes.
Nan Pao Resins Chemical, a nimble player in the industry, has shown resilience despite challenges. The company reported sales of TWD 5.81 billion for Q2 2025 compared to TWD 5.78 billion the previous year, while net income dipped to TWD 553.54 million from TWD 672.37 million. Earnings per share also saw a decrease to TWD 4.59 from last year’s TWD 5.58, reflecting some pressure on profitability margins amidst industry headwinds and executive changes in June that may impact strategic direction moving forward with potential for adaptation and growth within its market niche.
Where To Now?
- Unlock more gems! Our Global Undiscovered Gems With Strong Fundamentals screener has unearthed 2949 more companies for you to explore.Click here to unveil our expertly curated list of 2952 Global Undiscovered Gems With Strong Fundamentals.
- Are you invested in these stocks already? Keep abreast of every twist and turn by setting up a portfolio with Simply Wall St, where we make it simple for investors like you to stay informed and proactive.
- Take control of your financial future using Simply Wall St, offering free, in-depth knowledge of international markets to every investor.
Contemplating Other Strategies?
This article by Simply Wall St is general in nature. We provide commentary based on historical data
and analyst forecasts only using an unbiased methodology and our articles are not intended to be financial advice. It does not constitute a recommendation to buy or sell any stock, and does not take account of your objectives, or your
financial situation. We aim to bring you long-term focused analysis driven by fundamental data.
Note that our analysis may not factor in the latest price-sensitive company announcements or qualitative material.
Simply Wall St has no position in any stocks mentioned.
New: Manage All Your Stock Portfolios in One Place
We’ve created the ultimate portfolio companion for stock investors, and it’s free.
• Connect an unlimited number of Portfolios and see your total in one currency
• Be alerted to new Warning Signs or Risks via email or mobile
• Track the Fair Value of your stocks
Have feedback on this article? Concerned about the content? Get in touch with us directly. Alternatively, email editorial-team@simplywallst.com