
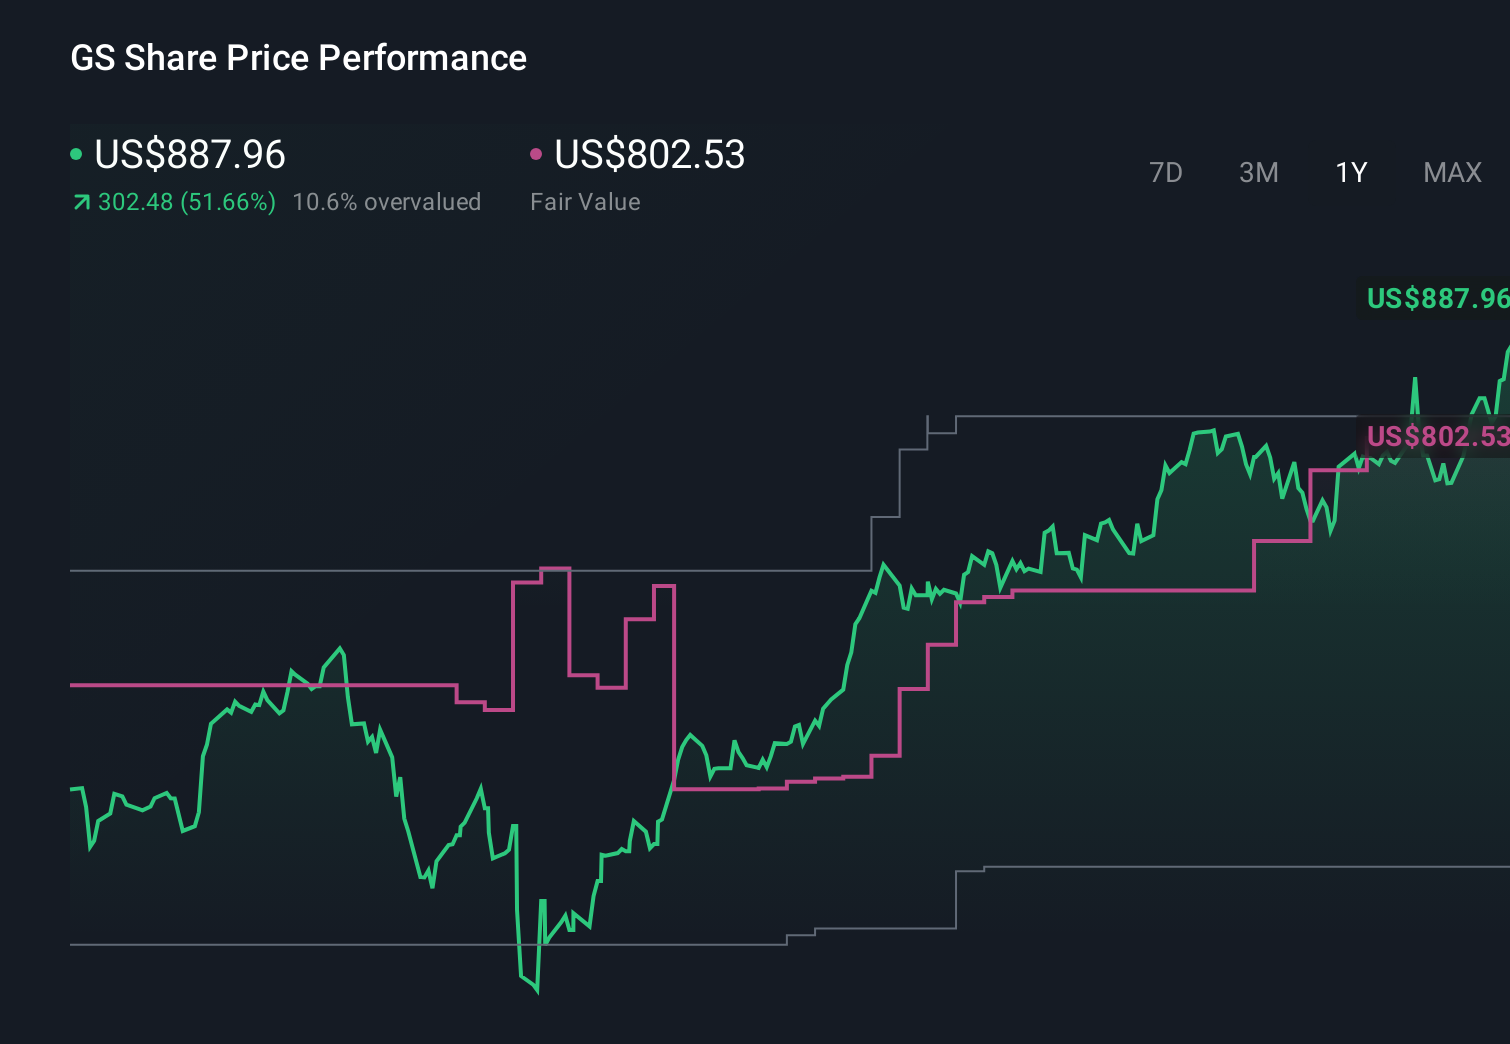
- If you are wondering whether Goldman Sachs Group shares still offer value at current levels, the key is understanding how the current price lines up with what the business may be worth.
- The stock last closed at US$931.86, with returns of a 3.1% decline over 7 days, 2.7% over 30 days, 1.9% year to date and 50.2% over the past year, plus 181.1% over 3 years and 282.0% over 5 years.
- Recent headlines around Goldman Sachs Group have focused on its role in global capital markets and investment banking activity, as well as ongoing commentary about its position among large U.S. financial institutions. Together, these stories help explain why investors have been reassessing both the potential and the risks they see in the stock.
- Right now, our simple valuation framework gives Goldman Sachs Group a value score of 3 out of 6. We will unpack this using several common valuation approaches and then consider a more holistic way to think about the company’s value.
Advertisement
Approach 1: Goldman Sachs Group Excess Returns Analysis
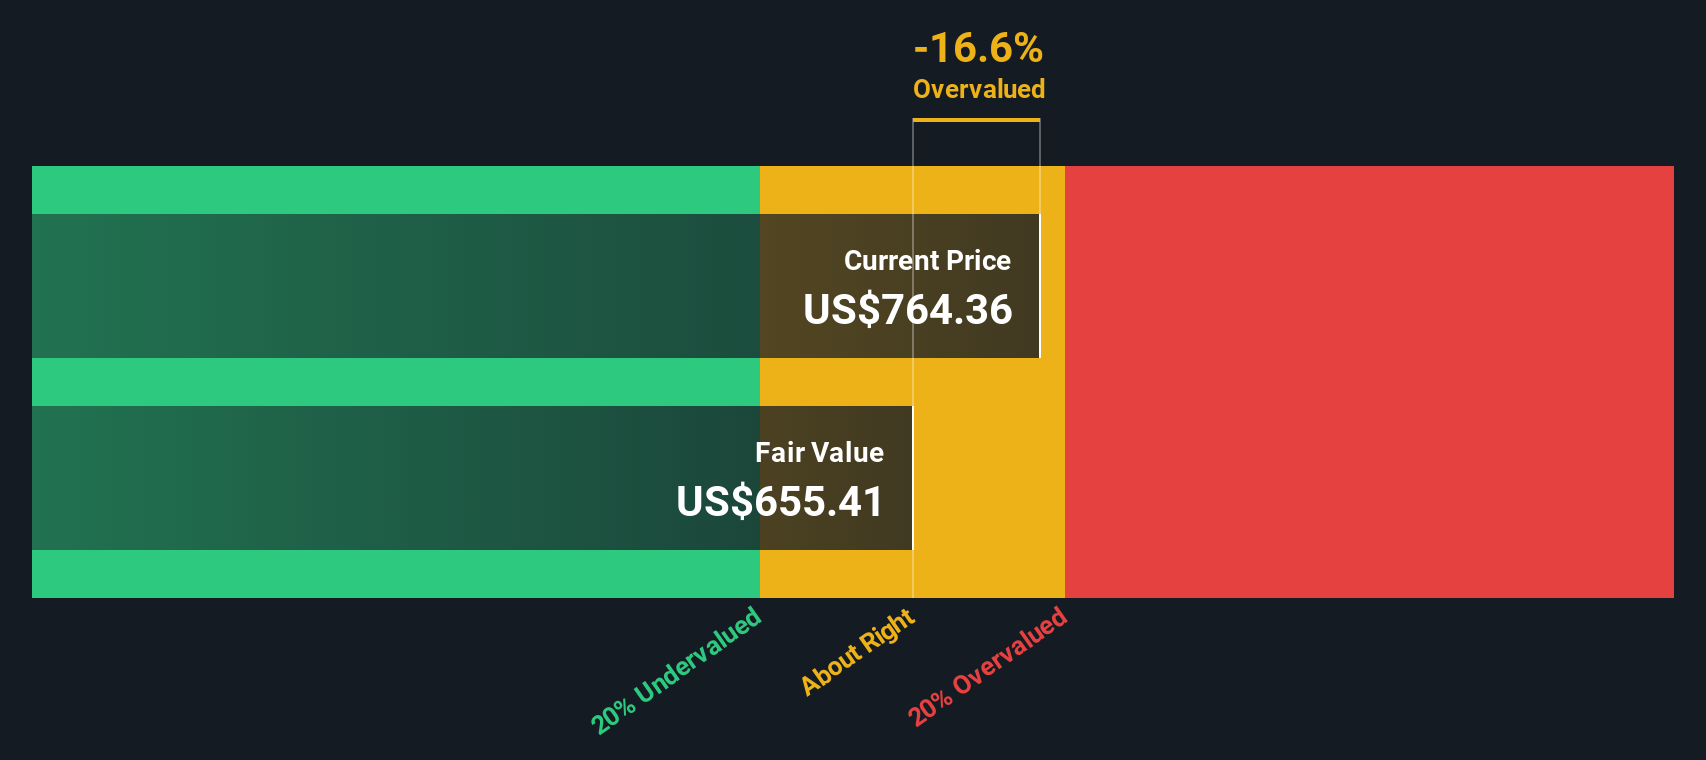
The Excess Returns model looks at how much value Goldman Sachs Group can generate above the return that shareholders typically require. Instead of focusing on cash flows, it starts with the company’s book value and earnings power, then asks how much of those earnings exceed the cost of equity.
For Goldman Sachs Group, the model uses a Book Value of $357.46 per share and a Stable EPS of $66.63 per share, based on weighted future Return on Equity estimates from 14 analysts. The implied Cost of Equity is $50.10 per share, which leaves an Excess Return of $16.53 per share. That excess is applied to a Stable Book Value of $400.81 per share, again informed by analyst estimates, and an Average Return on Equity of 16.62%.
Putting this together, the Excess Returns framework produces an estimated intrinsic value of about $579.66 per share. Compared with the recent share price of $931.86, this implies the stock is about 60.8% above the model’s estimate of value.
Result: OVERVALUED
Our Excess Returns analysis suggests Goldman Sachs Group may be overvalued by 60.8%. Discover 886 undervalued stocks or create your own screener to find better value opportunities.
Approach 2: Goldman Sachs Group Price vs Earnings
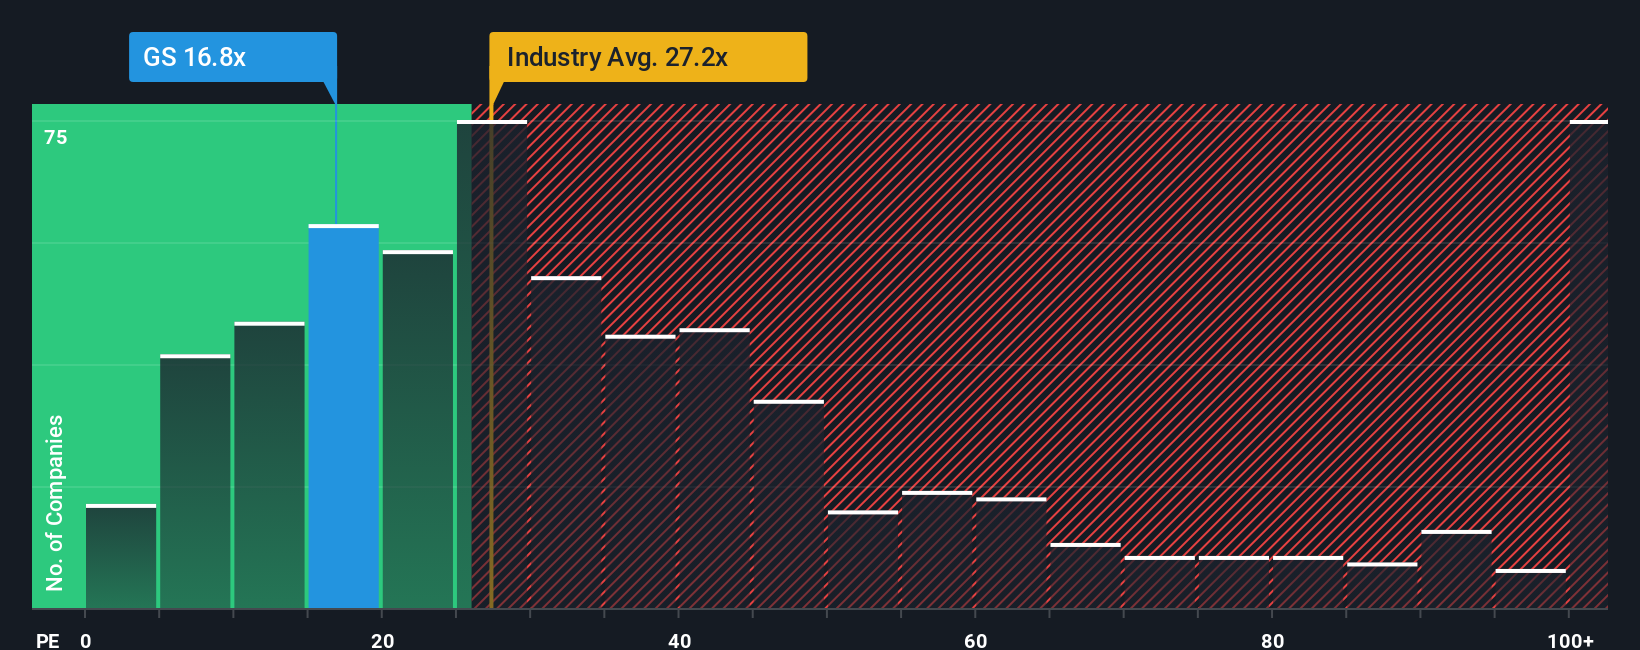
For a profitable company like Goldman Sachs Group, the P/E ratio is a useful quick check because it tells you how much you are paying for each dollar of earnings. Investors usually accept a higher P/E when they expect stronger growth or see lower risk, and prefer a lower P/E when growth expectations are modest or risks feel higher.
Goldman Sachs Group currently trades on a P/E of 17.94x. That sits below both the Capital Markets industry average P/E of 24.41x and a peer group average of 29.35x. Simply Wall St also calculates a proprietary “Fair Ratio” of 19.75x for Goldman Sachs Group, which reflects factors such as its earnings profile, industry, profit margins, market cap and identified risks.
This Fair Ratio is more tailored than a simple comparison with peers or the broad industry because it adjusts for the specific mix of growth, risk and profitability that is relevant to Goldman Sachs Group. Set against the current P/E of 17.94x, the Fair Ratio of 19.75x indicates that the shares are trading below this modelled level.
Result: UNDERVALUED
P/E ratios tell one story, but what if the real opportunity lies elsewhere? Discover 1425 companies where insiders are betting big on explosive growth.
Upgrade Your Decision Making: Choose your Goldman Sachs Group Narrative
Earlier we mentioned that there is an even better way to understand valuation, so let us introduce you to Narratives, which let you put a clear story behind the numbers like your assumed fair value and your expectations for revenue, earnings and margins.
A Narrative connects what you believe about a company to a structured forecast, then links that forecast to a fair value that you can compare with today’s share price to help you evaluate whether the stock looks attractive or not.
On Simply Wall St, within the Community page used by millions of investors, Narratives are designed to be easy to use, update automatically when fresh news or earnings arrive, and keep your Goldman Sachs Group fair value view in sync with new information.
For example, one Goldman Sachs Group Narrative might assume a relatively cautious earnings path and arrive at a lower fair value. Another, more optimistic, Narrative might use stronger earnings assumptions and therefore reach a higher fair value, giving you a clear sense of how different perspectives translate into different price signals.
Do you think there’s more to the story for Goldman Sachs Group? Head over to our Community to see what others are saying!
This article by Simply Wall St is general in nature. We provide commentary based on historical data
and analyst forecasts only using an unbiased methodology and our articles are not intended to be financial advice. It does not constitute a recommendation to buy or sell any stock, and does not take account of your objectives, or your
financial situation. We aim to bring you long-term focused analysis driven by fundamental data.
Note that our analysis may not factor in the latest price-sensitive company announcements or qualitative material.
Simply Wall St has no position in any stocks mentioned.
New: Manage All Your Stock Portfolios in One Place
We’ve created the ultimate portfolio companion for stock investors, and it’s free.
• Connect an unlimited number of Portfolios and see your total in one currency
• Be alerted to new Warning Signs or Risks via email or mobile
• Track the Fair Value of your stocks
Have feedback on this article? Concerned about the content? Get in touch with us directly. Alternatively, email editorial-team@simplywallst.com